Prompt overview
-
Purpose: Help analysts generate detailed multi-platform social media campaign reports with KPI comparisons and improvement strategies.
-
Audience: Social media managers, digital marketing analysts, brand strategists.
-
Distinctive feature: Multi-table markdown layout presenting metrics platform-wise, plus overall summary and tactical recommendations.
-
Outcome: Professional report highlighting performance, trends, and optimization pathways.
Quick Specs
- Media: Text
- Use case: Analysis, Content Strategy, Data Analysis & Insights
- Industry: Marketing & Sales
- Techniques: Role/Persona Prompting, Structured Output
- Models: Claude 3.5 Sonnet, Gemini 2.0 Flash, GPT-4o, Llama 3.1 70B
- Estimated time: 10-20 minutes
- Skill level: Intermediate
Variables to fill
-
Social media platforms: [INSERT SOCIAL MEDIA PLATFORMS]
-
Key metrics: [INSERT KEY METRICS]
-
Campaign goals: [INSERT CAMPAIGN GOALS]
-
Target audience: [INSERT TARGET AUDIENCE]
-
Reporting period: [INSERT REPORTING PERIOD]
Example variables block
-
Social media platforms: “Instagram, Facebook, Twitter”
-
Key metrics: “Reach, Impressions, Click-through rate, Engagement rate, Conversion rate”
-
Campaign goals: “Increase brand awareness by 30%, boost conversions by 15%”
-
Target audience: “Millennials aged 18-35 interested in tech gadgets”
-
Reporting period: “Q3 2025”
Prompt template
Act as a social media analyst generating comprehensive campaign analytics reports. For the platforms [Social media platforms], evaluate key metrics: [Key metrics], against each campaign goal [Campaign goals] over the period [Reporting period]. Provide insights on trends, strengths, weaknesses, and recommend strategic improvements to optimize performance for [Target audience].
**Inputs**
– Platforms: [Social media platforms]
– Metrics: [Key metrics]
– Goals: [Campaign goals]
– Audience: [Target audience]
– Period: [Reporting period]
**Process**
1. Create a summary of overall campaign success.
2. Generate a separate markdown table for each platform listing each metric, current value, goal, and insight.
3. Highlight significant trends and anomalies per platform.
4. Provide actionable recommendations for each platform to improve specific KPIs.
5. Summarize cross-platform findings and prioritized next steps.
**Output format**
Multiple markdown tables with columns: Metric | Current Value | Goal | Insights & Recommendations
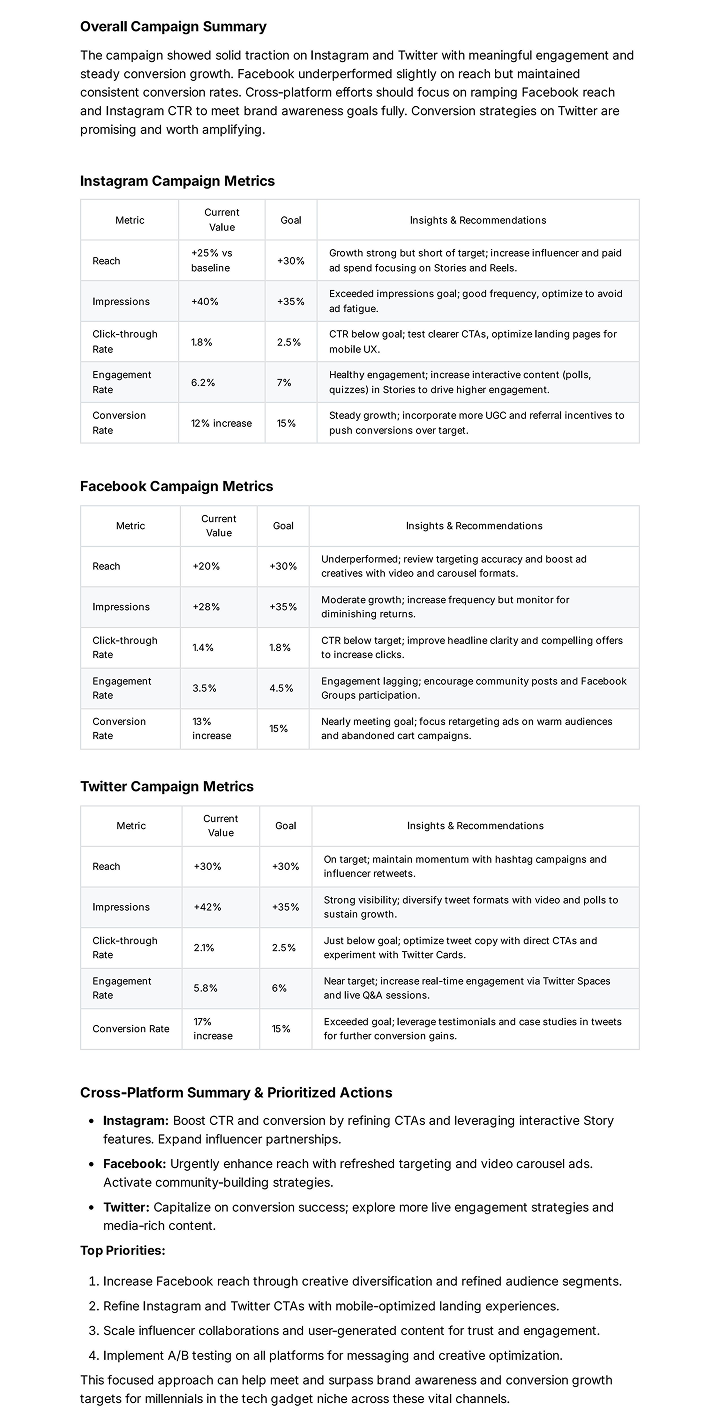
Sample Output
How to use
-
Input your actual data in the variables.
-
Collect metric values from platform dashboards or analytics tools.
-
Paste into the template to generate structured report.
-
Review insights and share with stakeholders.
-
Implement recommendations and monitor progress next cycle.
FAQ
-
How often should I generate social media campaign reports?
Monthly or quarterly, depending on campaign length and goals. -
What is the best way to compare metrics across platforms?
Use standardized KPIs like engagement rate, CTR, and conversions while normalizing for audience size differences. -
How do I prioritize recommendations?
Focus on metrics furthest from goals or metrics with biggest impact on conversions or brand awareness.
Compliance and notes
-
Ensure no personally identifiable information (PII) is shared unlawfully.
-
Use only aggregated, anonymized data.
-
Follow platform terms of service when sharing data externally.
Revision history
-
v1.0 – Multi-platform social media campaign analytics report prompt template – 2025-10-2
