Prompt overview
-
Reads policy details and builds a clean comparison table covering coverage, premiums, deductibles, limits, exclusions, and claims.
-
Calculates true yearly cost at different claim scenarios to show what the plan really costs, not just the premium.
-
Flags coverage gaps and gives clear, practical recommendations, including add‑ons or plan tweaks.
Quick Specs
- Media: Text
- Use case: Analysis, Classification & Categorization, Research & Investigation
- Industry: Insurance (Life, Health, Property)
- Techniques: Plan-Then-Solve, Role/Persona Prompting, Structured Output
- Models: Claude 3.5 Sonnet, Gemini 2.0 Flash, GPT-4o, Llama 3.1 70B
- Estimated time: 15-30 minutes
- Skill level: Advanced
Variables to fill
-
Plans to compare (paste details for each plan): {plans}
-
Life situation and dependents: {life}
-
Risk tolerance and finances: {risk_finance}
-
Specific concerns or priorities: {concerns}
-
Location and relevant factors (US by default): {location}
Prompt template
Act as an expert insurance analyst and risk assessment specialist with 12 years of underwriting experience, now advising consumers. Work in USD for a US context unless a different country is specified. Translate policy language into plain recommendations, highlight gaps, and compute realistic costs.
Inputs
– Insurance plans (verbatim details for each): [plans]
– Life situation and dependents: [life]
– Risk tolerance and financial situation: [risk_finance]
– Specific concerns or priorities: [concerns]
– Location and relevant factors: [location]
Process
1. Normalize plan data into consistent fields: plan name/type, monthly premium, deductible, coinsurance, copays, out‑of‑pocket (OOP) max, key coverages, exclusions/limitations, network/claim process.
2. Build a Plan Comparison Matrix with one row per plan and the fields above.
3. Gap Analysis: identify missing or weak protections relative to the user’s life situation (e.g., out‑of‑network pediatric specialists, Rx tiers, maternity, dental/vision, property riders, waiting periods).
4. Cost‑Effectiveness Assessment: compute total annual cost in three scenarios and show which plan is cheapest in each:
Low use: premiums only + one PCP visit + routine Rx
5. Moderate use: premiums + a few visits/tests + one ER or urgent care event
6. High use: premiums + hitting deductible + coinsurance up to OOP max
7. Recommendations: choose the most suitable plan and list targeted add‑ons or tweaks; if two plans are close, explain the deciding factor clearly. Keep language simple and actionable.
Output format (return this only)
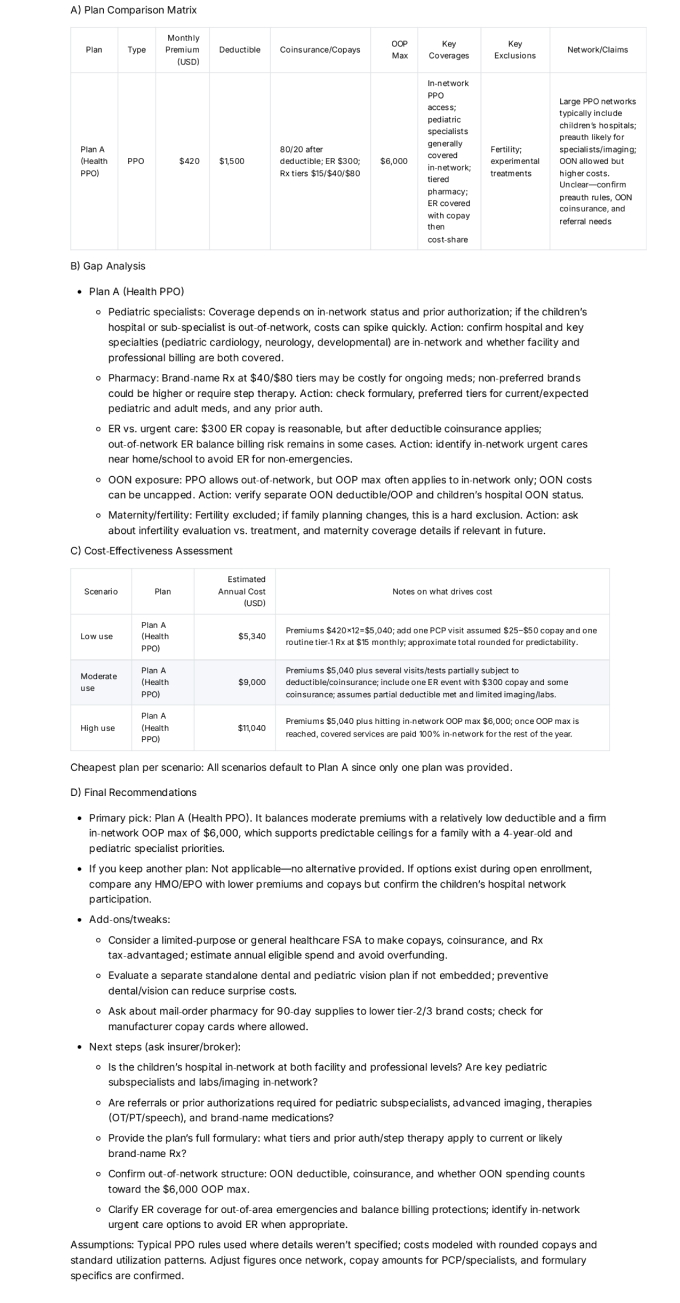
A) Heading: Plan Comparison Matrix
Provide a markdown table with columns: Plan | Type | Monthly Premium (USD) | Deductible | Coinsurance/Copays | OOP Max | Key Coverages | Key Exclusions | Network/Claims
B) Heading: Gap Analysis
Bullets grouped by plan. For each plan list the top gaps/risks (max 5) and why they matter given the user’s situation.
C) Heading: Cost‑Effectiveness Assessment
Provide a markdown table with columns: Scenario | Plan | Estimated Annual Cost (USD) | Notes on what drives cost
Scenarios: Low use, Moderate use, High use (as defined in Process step 4). Show the cheapest plan per scenario.
D) Heading: Final Recommendations
– Primary pick: [Plan], with a 1–2 sentence reason tied to user’s priorities.
– If you keep another plan: when it wins and why.
– Add‑ons/tweaks: list specific riders, higher/lower deductible options, or HSAs/FSAs if helpful.
– Next steps: exact questions to ask the insurer/broker to confirm fine print (preauth, network, formulary, waiting periods).
Formatting rules
– Use USD formatting and round to whole dollars where possible.
– If any input field is missing, ask one short clarifying question, then proceed.
– Do not copy marketing language; keep to facts from the plan details provided.
– If a plan hides a term, label it “Unclear—confirm with insurer” and add it to Next steps.
– Keep tables under 10 columns wide and avoid line wraps in headers.
Sample Output
How to use
-
Paste the plan details exactly as they appear (benefit summaries or notes are fine).
-
Add life situation, risk tolerance, and priorities so the advice fits real needs.
-
Run the prompt, review the Matrix first, then read the Gap Analysis and Costs.
-
Use the Final Recommendations and Next steps to talk to an insurer or broker before choosing.
FAQ
-
What if two plans have different networks?
Check that key doctors/hospitals are in‑network. A cheaper plan can cost more if care is out‑of‑network. -
Why compare OOP max?
It caps worst‑case spending in a bad year; lower OOP max can be worth a higher premium for families. -
Can I use this for other insurance types (auto/home/life)?
Yes. Replace medical fields with relevant ones (e.g., liability limits, comprehensive/collision, replacement cost).
Compliance and notes
-
Educational template only. This is not legal, tax, or financial advice. Policies vary by state and carrier.
-
Do not paste policy numbers or personal identifiers into public tools.
Revision history
-
v1.1 – Added three‑scenario cost table, “Unclear—confirm” flags, and broker questions – 2025‑10‑12
