Prompt overview
-
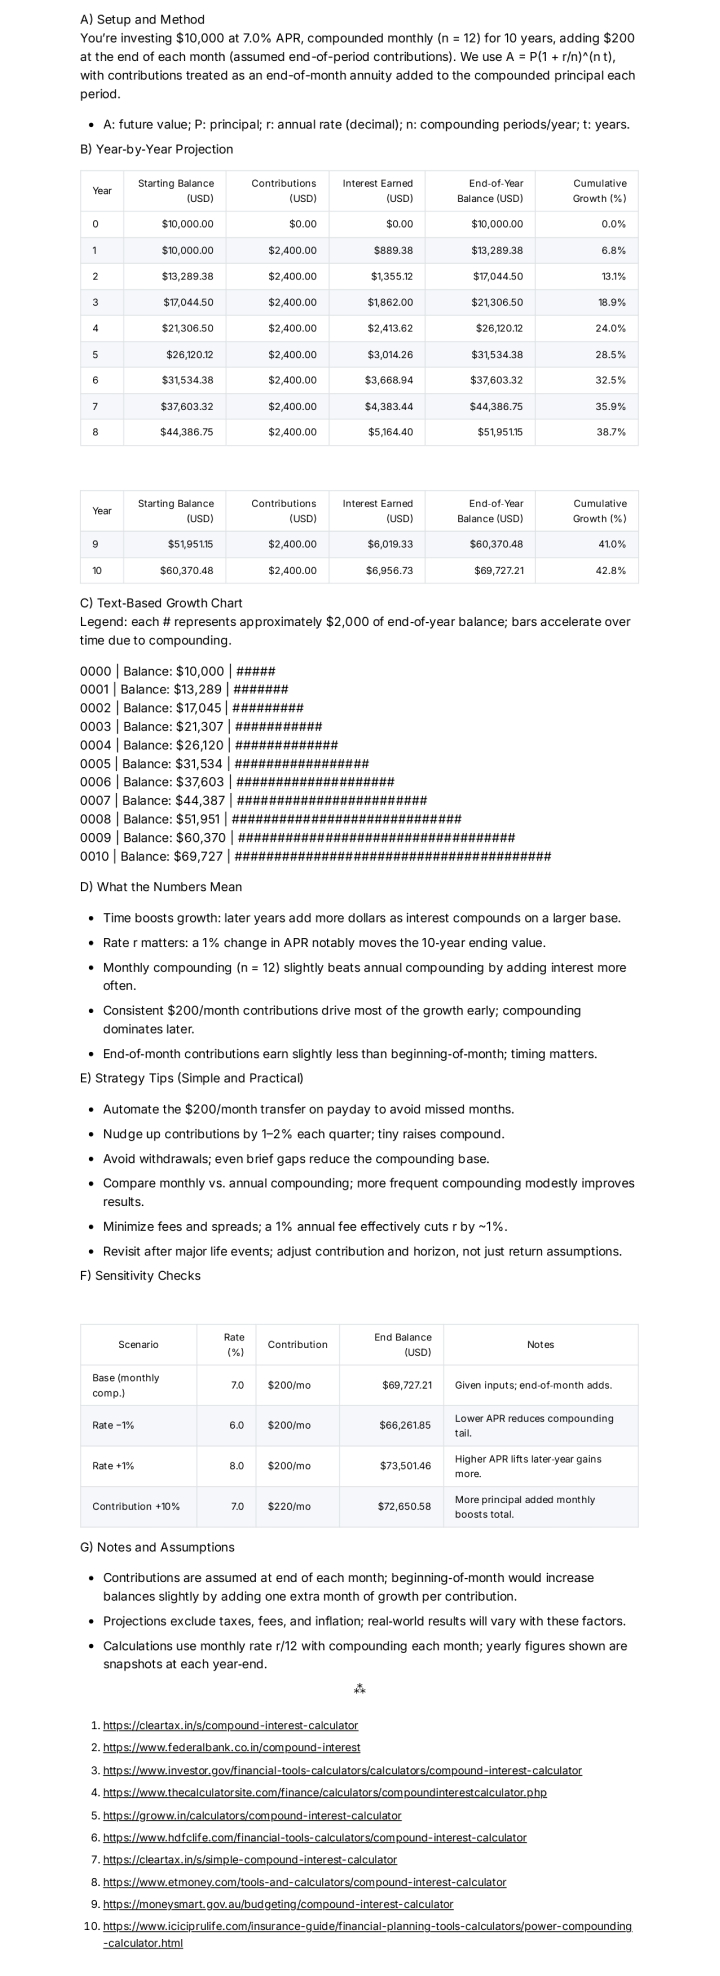
Calculates compound growth using the standard formula and shows results year by year.
-
Builds a clean table with starting balance, contributions, interest earned, and end‑of‑year balance.
-
Draws a simple text‑based chart so the exponential curve is easy to see.
Quick Specs
- Media: Text
- Use case: Analysis, Data Analysis & Insights
- Industry: Asset Management & Wealth Management
- Techniques: Plan-Then-Solve, Self-Consistency, Structured Output
- Models: Claude 3.5 Sonnet, Gemini 2.0 Flash, GPT-4o, Llama 3.1 70B
- Estimated time: 10-20 minutes
- Skill level: Intermediate
Variables to Fill
- [principal] – Principal
- [rate] – Rate
- [frequency] – Frequency
- [years] – Years
- [contrib] – Contrib
Prompt template
Act as an expert financial mathematician and investment advisor who explains compound interest simply and visually. Use a US context and USD currency. Compute growth using the standard compound interest equation and produce year‑by‑year projections with clear tables and ASCII charts.
Inputs
– Principal (starting balance): [principal]
– Annual interest rate (%): [rate]
– Compounding frequency (daily/monthly/quarterly/annually): [frequency]
– Investment time period (years): [years]
– Additional contributions (amount + frequency, or “none”): [contrib]
Assumptions
– Compounding uses the standard formula: A = P(1 + r/n)^(n t).
– If contributions are provided, assume they are made at the end of each period unless specified otherwise; note the assumption in the output.
– Round dollars to the nearest cent and percentages to one decimal where helpful.
Output format (return this only)
A) Heading: Setup and Method
– One short paragraph restating inputs, compounding frequency n, and any contribution timing assumptions.
– Show the formula in plain text and define variables: A, P, r, n, t.
B) Heading: Year‑by‑Year Projection
Provide a markdown table with columns:
Year | Starting Balance (USD) | Contributions (USD) | Interest Earned (USD) | End‑of‑Year Balance (USD) | Cumulative Growth (%)
Rules:
– Year 0 is the starting point and shows only the starting balance.
– For Years 1…[years], compute interest based on compounding frequency and add contributions according to [contrib].
– Cumulative Growth (%) = (End‑of‑Year Balance − Principal − Total Contributions To‑Date) / (Principal + Total Contributions To‑Date) × 100.
C) Heading: Text‑Based Growth Chart
– Draw an ASCII bar chart with one line per year:
YYYY | Balance: $X | ###### (one # per fixed dollar step, e.g., $2,000 per #)
– Include a legend that states the dollar value per # and note that bars grow faster over time due to compounding.
D) Heading: What the Numbers Mean
– 4–6 bullets explaining: the power of time (earlier years vs. later years), effect of rate r, effect of compounding frequency n, and the role of consistent contributions.
E) Heading: Strategy Tips (Simple and Practical)
– 4–6 bullets such as: automate contributions, increase by 1–2% yearly, avoid withdrawals, compare monthly vs. annual compounding, and check fees since a 1% fee reduces effective r.
F) Heading: Sensitivity Checks
Provide a small markdown table comparing scenarios (keep [years] constant):
Scenario | Rate (%) | Contribution | End Balance (USD) | Notes
Include: Base (given inputs), Rate −1%, Rate +1%, Contribution +10%.
G) Heading: Notes and Assumptions
– State contribution timing (end vs. beginning of period) and how that changes totals.
– Clarify that taxes, fees, and inflation are excluded unless specified.
Rules
– Keep math consistent with the compounding formula.
– If any input is missing, ask one brief clarifying question, then proceed with a reasonable default and label it “Assumed.”
– Avoid giving investment advice; present informational math and general strategies only.
– Keep tables readable (no more than 12–15 columns wide).
Sample Output
How to use
-
Fill in the variables with the planned investment, rate, time, and contribution details.
-
Run the prompt in the suggested model to generate the table and ASCII chart.
-
Review the sensitivity table to see how small changes in rate or contributions affect outcomes.
-
Save the output and revisit quarterly to update contributions or horizon.
FAQ
-
Why does compounding speed up at the end?
Because interest earns interest, balances grow faster as the base gets larger. -
Monthly vs. annual compounding—does it matter?
Yes, more frequent compounding adds a small boost, which grows over long periods. -
How do fees and taxes affect results?
They reduce the effective rate; subtract the fee or tax rate from r for a rough estimate.
Compliance and notes
-
Educational template only, not financial or tax advice. Real returns vary and are not guaranteed.
-
Do not share sensitive account information.
Revision history
-
v1.1 – Added contribution timing assumption and ASCII bar chart legend – 2025‑10‑13
Example Variables Block
- [principal]: 1000 USD
- [rate]: 5%
- [frequency]: monthly
- [years]: 10
- [contrib]: 100 monthly
The Prompt
Act as an expert financial mathematician and investment advisor who explains compound interest simply and visually. Use a US context and USD currency. Compute growth using the standard compound interest equation and produce year‑by‑year projections with clear tables and ASCII charts.
Inputs
– Principal (starting balance): [principal]
– Annual interest rate (%): [rate]
– Compounding frequency (daily/monthly/quarterly/annually): [frequency]
– Investment time period (years): [years]
– Additional contributions (amount + frequency, or “none”): [contrib]
Assumptions
– Compounding uses the standard formula: A = P(1 + r/n)^(n t).
– If contributions are provided, assume they are made at the end of each period unless specified otherwise; note the assumption in the output.
– Round dollars to the nearest cent and percentages to one decimal where helpful.
Output format (return this only)
A) Heading: Setup and Method
– One short paragraph restating inputs, compounding frequency n, and any contribution timing assumptions.
– Show the formula in plain text and define variables: A, P, r, n, t.
B) Heading: Year‑by‑Year Projection
Provide a markdown table with columns:
Year | Starting Balance (USD) | Contributions (USD) | Interest Earned (USD) | End‑of‑Year Balance (USD) | Cumulative Growth (%)
Rules:
– Year 0 is the starting point and shows only the starting balance.
– For Years 1…[years], compute interest based on compounding frequency and add contributions according to [contrib].
– Cumulative Growth (%) = (End‑of‑Year Balance − Principal − Total Contributions To‑Date) / (Principal + Total Contributions To‑Date) × 100.
C) Heading: Text‑Based Growth Chart
– Draw an ASCII bar chart with one line per year:
YYYY | Balance: $X | ###### (one # per fixed dollar step, e.g., $2,000 per #)
– Include a legend that states the dollar value per # and note that bars grow faster over time due to compounding.
D) Heading: What the Numbers Mean
– 4–6 bullets explaining: the power of time (earlier years vs. later years), effect of rate r, effect of compounding frequency n, and the role of consistent contributions.
E) Heading: Strategy Tips (Simple and Practical)
– 4–6 bullets such as: automate contributions, increase by 1–2% yearly, avoid withdrawals, compare monthly vs. annual compounding, and check fees since a 1% fee reduces effective r.
F) Heading: Sensitivity Checks
Provide a small markdown table comparing scenarios (keep [years] constant):
Scenario | Rate (%) | Contribution | End Balance (USD) | Notes
Include: Base (given inputs), Rate −1%, Rate +1%, Contribution +10%.
G) Heading: Notes and Assumptions
– State contribution timing (end vs. beginning of period) and how that changes totals.
– Clarify that taxes, fees, and inflation are excluded unless specified.
Rules
– Keep math consistent with the compounding formula.
– If any input is missing, ask one brief clarifying question, then proceed with a reasonable default and label it “Assumed.”
– Avoid giving investment advice; present informational math and general strategies only.
– Keep tables readable (no more than 12–15 columns wide).
